
Attainment and Results
Summer 2025 Data
Official Infant Data comprises of Early Years Foundation Stage Good Level of Development Data and phonics Data for Year 1. Key Stage 2 Data comprise of the Statutory Assessments that children take at the end of Year 6 and teacher assessment for writing.
There is no longer any official data for Key Stage 1 SATs.
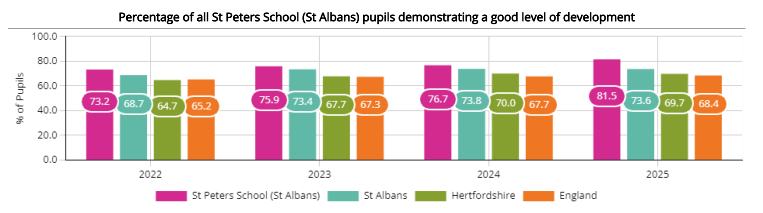
EYFS - Good Level of Development (GLD)
| St Peter's School | St Albans | Hertfordshire | National |
|---|---|---|---|
| 81.5% | 73.6% | 69.7% | 68.4% |
Phonics
Year 1 Phonics - Percentage of children reaching the expected standard for phonics
| St Peter's School | St Albans | Hertfordshire | National |
|---|---|---|---|
| 91.7% | 83.6% | 81.6% | 79.9% |
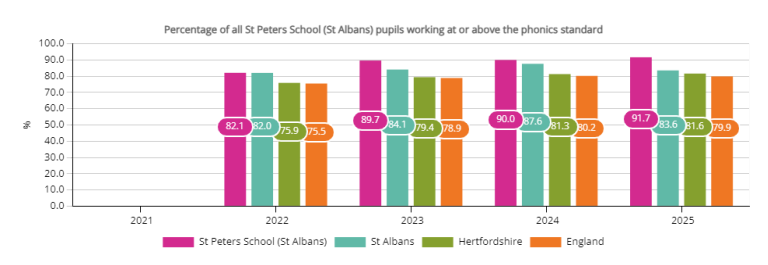
Children who do not meet the expected standard in Year 1 are supported and are reassessed in Year 2. 60% of these children passed during their reassessment.
Key Stage 2
| St Peter's School | St Albans | Hertfordshire | National | |
|---|---|---|---|---|
| Pupils Working at or Above the Reading, Writing and Maths Standard |
73.3% |
74.3% | 63.3% | 62.2% |
|
Pupils Working at a Higher Standard in Reading, Writing and Maths |
13.3% | 16.9% | 10.5% | 8.4% |
| Pupils Working at or Above the Reading Standard | 86.7% | 85.4% | 78.0% | 75.1% |
| Pupils working at a higher reading standard | 63.3% | 54.4% | 39.1% | 33.4% |
| Pupils Working at or Above the Writing Standard | 80% | 80% | 72.2% | 72.3% |
| Pupils Working at a Greater Depth in Writing | 20% | 23.2% | 15.5% | 12.8% |
| Pupils Working at or Above the Maths Standard | 76.7% | 84.4% | 75.6% | 74.1% |
| Pupils Working at a Higher Standard in Maths | 26.7% | 42.6% | 30% | 26.3% |
Average Scaled Scores
| St Peter's School | St Albans | Hertfordshire | National | |
|---|---|---|---|---|
| Reading | 109.7 | 109.2 | 106.6 | 105.6 |
| Maths | 105.6 | 107.9 | 105.4 | 104.7 |
| GAPS | 107.4 | 108.7 | 106.3 | 105.4 |